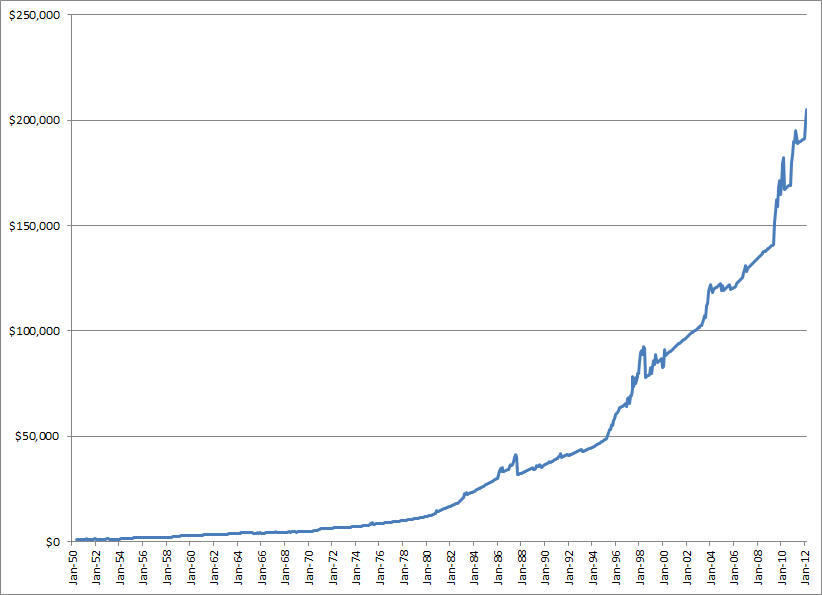
The following chart is the hypothetical equity growth curve from January 1950 to March 2012 (starting with $1000 initial capital):
For comparison, this is the price chart for S&P 500 Index from January 1950 to March 2012:
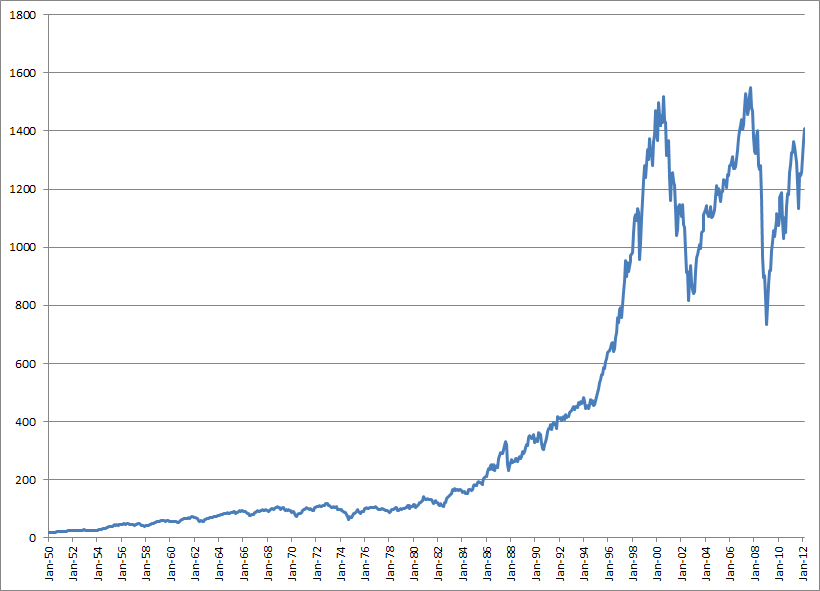
In the past 61 years, ETF Asset Management System increased the initial capital 205 times (from $1,000 to $205,287). Meanwhile, the return for S&P 500 Index was 79 times (from 17.69 to 1408.47).
In the evaluation process, I also found that it is imperative to exchange assets immediately whenever the ETF Asset Management System gives out a signal. In doing so, large market collapses such as in October 1987 and August 1998 could be circumvented. This just illustrate the importance of quick actions during major market transition periods.
=========
My investment blogs:
http://murmuronhudson.blogspot.com
http://blog.sina.com.cn/murmuronhudson
http://blog.wenxuecity.com/myindex.php?blogID=48731
No comments:
Post a Comment